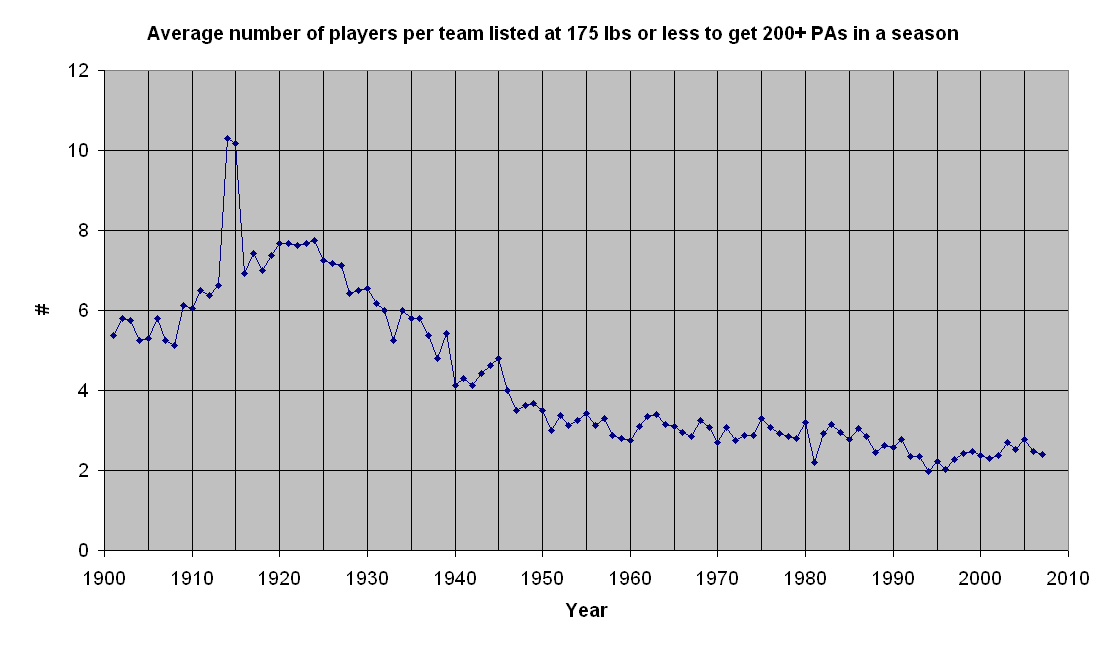
Average number of players per team listed at 165 lbs or less to get 200+ PAs in a season, 1901-2007
Posted by Andy on December 15, 2007
I used the PI's weight data to generate a list, which I then graphed in Excel. Click through.
 Explanations:
- I did a very simple search for players listed at 175 lbs or less who had 200 PAs in a season, then divided the results by "Years with players." Then I made a list of the total number of teams in baseball for each year and divided the number of players by the number of teams for each year.
- I lowered the bar to 200 PAs to try to avoid issues with shortened seasons due to strike (though 1981 is still screwy as you can see), and also to try to get a better idea of the total number of regular big-leaguers who met the weight criterion.
- And keep in mind that this weight data is the player's listed weight. We all know that real weights might be a lot higher, but this is what was printed in the media guide or on backs of baseball cards, etc.
Obviously 1914-1915 stick out as an aberration. I have no idea what happened there, except that it comes during the period of United States involvement in World War I. is it as simple as the fact that people ate less during this period when supplies were less abundant? I'm not sure.
Another thing to keep in mind is that this graph doesn't correct for baseline changes in the US population. Over the last 100 years, Americans have generally gotten heavier, due to a number of factors including cultural changes and availability of a variety of foods. I'm sure that the fraction of the general population weighing 175 lbs or less has dropped over this period. This doesn't translate one-for-one with athletes, since you figure that baseball players are usually in great shape (chubby players aside, who have existed in all eras (see also Babe Ruth and John Kruk.)
The steroids out still sticks out a bit, with a big dropoff in 1994 (which probably has some 1994 strike effects) but that much lower level continuing through 1997. Since 1998 we've generally seen an increase in the number of undersized players.
I don't know what this all means since it's such a large average over so many different conditions.
sdfs
December 15th, 2007 at 12:37 pm
The US joined WWI in 1917. Any chance 1914-1915 includes the Federal League?
December 15th, 2007 at 2:31 pm
I think you nailed it the Federal League had 66 players over those two seasons, the AL and NL had 62 and 65 respectively.
193 players/2 years =96.5 per league/year and 96.5/24teams =4.03 skinny players per team year., which would actually be a slight dip from the rest of the decade.
But if you calculated the same 193 players over 16 teams you get 12.06 per team, which even though is a higher figure than the graph indicates, it certainly explains the spike. I don't know why my figures don't precisely match Andy's, but I would venture a guess that he didn't consider the existance of the Federal League, and did his calculations based on 16 teams rather 24.
December 15th, 2007 at 4:54 pm
You guys are exactly right, and correcting for the Federal League complete removes that blip.
December 15th, 2007 at 7:20 pm
if you want to correct for the increasing obiesity of Americans over time, this might take a bit longer to do, but find in some census data the average weight of the typical adult male American every year, and then do the search each year as to the number of players on each team under that number