This is our old blog. It hasn't been active since 2011. Please see the link above for our current blog or click the logo above to see all of the great data and content on this site.

The (continually) dying art of the complete game

Posted by Andy on December 27, 2008

It shall come as no surprise to anyone that the Complete Game is a dying art. That's not news. But I thought I'd graph a couple of the sets of numbers to show just how rare it's becoming.

Firstly, here are the fraction of starts in MLB games that resulted in complete games.

(click on the graph for a larger version)

Basically, complete games have been in decline for as long as we have detailed data, except for a small renaissance in the late 60s through mid 70s. Whereas it was routine back then to see more than 1 out of every 4 starts result in a complete game (meaning that, on average, 1 out of every 2 games featured a CG by either of the starters,) the average has now fallen below 3% yearly, a decrease of a factor of 10 from 50 years earlier.

Here's another way of looking at it, one that allows us to look waaaaay back. Checking out the progressive complete game leaders page allows us to see what the leading career total was among active pitchers each season. Here's a graph of that data.
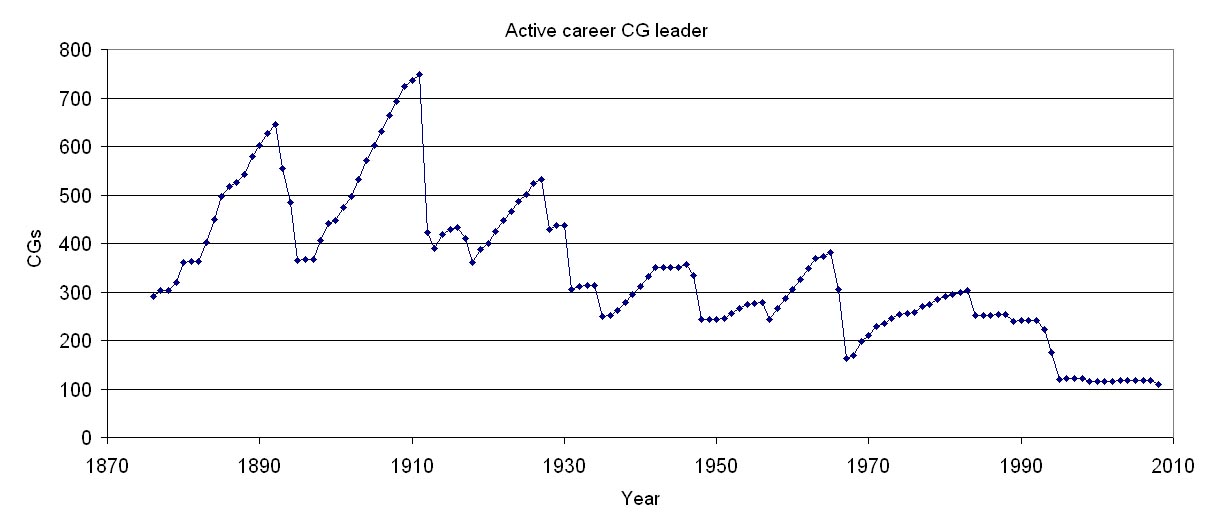
Here we see that prior to 1950, it was common for the active career CG leader to have at least 300 career complete games. Not so anymore. When Greg Maddux retired a few weeks ago, he was the career leader with 109 CGs. Now it's Randy Johnson with just 100. The next 3 guys after Johnson are all effectively retired already: Curt Schilling (83), Mike Mussina (57), and Tom Glavine (56.) Two more guys who also might not pitch anymore come next: John Smoltz (53) and Pedro Martinez (46.) That means that when RJ retires, the career leader will almost certainly have fewer than 100 career CGs.

Incidentally, the big drop-offs on the above graph occurred when the far-and-away active leader retired, such as Pud Galvin in 1892, Cy Young in 1911, Walter Johnson in 1927, Burleigh Grimes in 1934, Robin Roberts in 1966, etc.

I also researched complete game losses. It's generally more similar, but such games were more common in the 1970s than in the late 50s and 60s. In the late 1950's, about 5-5.5% of starts resulted in complete game losses. That number fell to 3% in the 1960s before peaking at 7% in 1974. Since then, it has gradually dropped, to 5% in 1979, then 4% in 1983, then 3% in 1989, then 2% in 1994, and falling below 1% in 2003. This past year, just 30 starts, or 6/10ths of 1% were complete game losses.

Posted in Game Finders | 2 Comments »

Bouncing Around with Style

Posted by Raphy on December 25, 2008

When Mark Teixeira takes the field for the Yankees next season, he will be playing for his 4th franchise in 3 years. Since 1901, 43 Players (36 if you remove players with multiple overlapping seasons) have been on 4 franchises in 3 years while playing at least 400 games. Here is the list:

Player **OPS+** Tms G From To Ages Positions Teams
Cliff Floyd 142 4 403 2001 2003 28-30 *7/9D FLA-MON-BOS-NYM
Roy Cullenbine 137 4 415 1942 1944 28-30 *9/7538 WSH-SLB-NYY-CLE
Roy Cullenbine 137 4 410 1941 1943 27-29 79/358 SLB-WSH-NYY-CLE
Bobby Bonds 131 4 460 1977 1979 31-33 *9/D CAL-TEX-CHW-CLE
Jose Guillen 126 4 432 2003 2005 27-29 *97/D8 CIN-OAK-ANA-WSN
Ken Harrelson 126 4 419 1967 1969 25-27 *93/7 WSA-KCA-BOS-CLE
Dan McGann 121 4 405 1898 1900 26-28 *3/4 BLN-WHS-BRO-STL
David Segui 117 4 414 1998 2000 31-33 *3/D97 SEA-TOR-TEX-CLE
Todd Zeile 111 5 481 1996 1998 30-32 *5/3 PHI-BAL-LAD-FLA-TEX
Todd Zeile 109 4 467 1998 2000 32-34 *53/D LAD-FLA-TEX-NYM
Sammy Strang 109 4 410 1901 1903 24-26 *5/4896 NYG-CHC-CHW-BRO
Jose Cruz 107 5 426 2003 2005 29-31 *9/87 SFG-TBD-LAD-ARI-BOS
Willie Davis 106 4 445 1973 1975 33-35 *8/97 LAD-MON-STL-TEX
Jeromy Burnitz 106 4 436 2003 2005 34-36 *98/7D NYM-LAD-COL-CHC
Todd Zeile 105 5 436 1995 1997 29-31 *5/37 STL-CHC-PHI-BAL-LAD
Willie Horton 105 6 417 1977 1979 34-36 *D/7 TEX-DET-TOR-OAK-CLE-SEA
Lee Thomas 105 4 419 1964 1966 28-30 39/78 LAA-BOS-CHC-ATL
Dave Parker 104 4 433 1989 1991 38-40 *D/39 OAK-MIL-TOR-CAL
Tommy Davis 104 4 433 1967 1969 28-30 *7/398 NYM-CHW-HOU-SEP
Willie Davis 101 4 434 1974 1976 34-36 *8/97 MON-STL-TEX-SDP
Kenny Lofton 100 5 412 2001 2003 34-36 *8 CLE-SFG-CHW-PIT-CHC
Tony Fernandez 100 4 401 1992 1994 30-32 *6/54 SDP-NYM-TOR-CIN
Chad Curtis 100 4 406 1995 1997 26-28 *87/9 DET-LAD-NYY-CLE
Jay Payton 99 4 424 2003 2005 30-32 *78/9D COL-SDP-OAK-BOS
Mike Mitchell 98 4 414 1912 1914 32-34 *97/8 CIN-PIT-CHC-WSH
Tony Gonzalez 97 4 412 1968 1970 31-33 *8/79 PHI-SDP-ATL-CAL
Eric Byrnes 96 4 412 2004 2006 28-30 *78/9D OAK-COL-BAL-ARI
Keith Moreland 95 4 419 1987 1989 33-35 53/D72 CHC-SDP-DET-BAL
Chad Curtis 95 4 413 1996 1998 27-29 *87/9D LAD-DET-NYY-CLE-NYY
Eric Byrnes 94 4 429 2005 2007 29-31 *78/9D COL-OAK-BAL-ARI
Willie Montanez 93 4 448 1978 1980 30-32 *3/D NYM-TEX-SDP-MON
Brian McRae 93 4 446 1997 1999 29-31 *8/D NYM-CHC-NYM-COL-TOR
Steve Finley 91 4 413 2004 2006 39-41 *8/D LAD-ARI-LAA-SFG
Tommy Davis 91 5 413 1968 1970 29-31 *7/398 CHW-HOU-SEP-CHC-OAK
Gary Matthews 91 5 407 2001 2003 26-28 *89/7D PIT-CHC-NYM-BAL-SDP
Jose Hernandez 90 4 454 2001 2003 31-33 *6/58437 MIL-PIT-COL-CHC
Deron Johnson 89 5 404 1973 1975 34-36 *D3 PHI-OAK-MIL-BOS-CHW
Cass Michaels 88 4 412 1950 1952 24-26 *4/5 WSH-CHW-WSH-SLB-PHA
Charlie Hayes 87 4 402 1994 1996 29-31 *5 COL-PHI-PIT-NYY
Lyn Lary 84 4 417 1934 1936 28-30 *6/3 NYY-BOS-WSH-SLB
Royce Clayton 75 4 426 2004 2006 34-36 *6 COL-ARI-WSN-CIN
Roberto Pena 73 4 417 1968 1970 31-33 *6/453 PHI-SDP-OAK-MIL
Tony Womack 71 4 401 2002 2004 32-34 *64/89 ARI-COL-CHC-STL

A few notes:

1. Over the last 2 seasons Teixeira has a OPS+ of 151 in 289 games. He has a chance to be at the top of this list.

2. Aside from Texiera, the only player to play at least 270 games and on 3 different franchises in the last 2 years is Jason Kendall. In that time Kendall has had an  OPS+ of 68. Should Kendall switch franchises during the season, he  could wind up at the end of the list.

3. Todd Zeile appears 3 times on the list. In the 6 years from 1995 to 2000, Zeile played over 900 games for 8 different franchises. Amazingly enough, Zeile would have qualified again just 4 years later, but he fell 5 games short. In all, in the 10 years from 1995-2004 Zeile played for 11 different franchises and still played 1435 games.

Posted in Uncategorized | 1 Comment »

Dock Ellis Passes

Posted by Steve Lombardi on December 20, 2008

Dock Ellis passed away yesterday. (Hat tip to BBTF.) Few realize this, but, while Ellis was best known for his days with the Pirates, he was a member of one of the best Yankees starting rotations in terms of wins. Via Baseball-Reference.com's Play Index Pitching Season Finder, here are the only Yankees teams where more than one starting pitcher had 17+ wins. As you can see, the 1976 trio of Catfish Hunter, Ed Figueroa and Dock Ellis were workhorses for Billy Martin that season.

 Year Lg Team                              Number Players Matching
+----+--+---------------------------------+------+-----------------------------------------+
 1927 AL New York Yankees                       4 Wilcy Moore / Waite Hoyt / Herb Pennock / Urban Shocker
 1923 AL New York Yankees                       4 Sam Jones / Waite Hoyt / Joe Bush / Herb Pennock
 2003 AL New York Yankees                       3 Andy Pettitte / Roger Clemens / Mike Mussina
 1976 AL New York Yankees                       3 Catfish Hunter / Ed Figueroa / Dock Ellis
 1963 AL New York Yankees                       3 Ralph Terry / Jim Bouton / Whitey Ford
 1951 AL New York Yankees                       3 Allie Reynolds / Vic Raschi / Ed Lopat
 1932 AL New York Yankees                       3 Lefty Gomez / Red Ruffing / Johnny Allen
 1928 AL New York Yankees                       3 George Pipgras / Waite Hoyt / Herb Pennock
 1924 AL New York Yankees                       3 Waite Hoyt / Herb Pennock / Joe Bush
 1922 AL New York Yankees                       3 Bob Shawkey / Joe Bush / Waite Hoyt
 1921 AL New York Yankees                       3 Carl Mays / Waite Hoyt / Bob Shawkey
 1920 AL New York Yankees                       3 Carl Mays / Jack Quinn / Bob Shawkey
 2006 AL New York Yankees                       2 Chien-Ming Wang / Randy Johnson
 2002 AL New York Yankees                       2 Mike Mussina / David Wells
 2001 AL New York Yankees                       2 Mike Mussina / Roger Clemens
 1998 AL New York Yankees                       2 David Cone / David Wells
 1980 AL New York Yankees                       2 Ron Guidry / Tommy John
 1979 AL New York Yankees                       2 Tommy John / Ron Guidry
 1978 AL New York Yankees                       2 Ed Figueroa / Ron Guidry
 1974 AL New York Yankees                       2 Pat Dobson / Doc Medich
 1969 AL New York Yankees                       2 Mel Stottlemyre / Fritz Peterson
 1968 AL New York Yankees                       2 Stan Bahnsen / Mel Stottlemyre
 1964 AL New York Yankees                       2 Whitey Ford / Jim Bouton
 1962 AL New York Yankees                       2 Ralph Terry / Whitey Ford
 1956 AL New York Yankees                       2 Johnny Kucks / Whitey Ford
 1955 AL New York Yankees                       2 Whitey Ford / Bob Turley
 1950 AL New York Yankees                       2 Ed Lopat / Vic Raschi
 1949 AL New York Yankees                       2 Vic Raschi / Allie Reynolds
 1948 AL New York Yankees                       2 Vic Raschi / Ed Lopat
 1938 AL New York Yankees                       2 Lefty Gomez / Red Ruffing
 1937 AL New York Yankees                       2 Lefty Gomez / Red Ruffing
 1936 AL New York Yankees                       2 Monte Pearson / Red Ruffing
 1934 AL New York Yankees                       2 Lefty Gomez / Red Ruffing
 1926 AL New York Yankees                       2 Urban Shocker / Herb Pennock
 1915 AL New York Yankees                       2 Ray Caldwell / Ray Fisher
 1910 AL New York Highlanders                   2 Russ Ford / Jack Quinn
 1906 AL New York Highlanders                   2 Jack Chesbro / Al Orth
 1905 AL New York Highlanders                   2 Jack Chesbro / Al Orth
 1904 AL New York Highlanders                   2 Jack Chesbro / Jack Powell

R.I.P. Dock.

Posted in Season Finders | 1 Comment »

Something For Sabathia To Shoot For

Posted by Steve Lombardi on December 14, 2008

Playing around with Baseball-Reference.com's Play Index Pitching Season Finder, I set the controls for "Playing for the NYY, For single seasons, From 1901 to 2008, Throws LH, (requiring GS>=30, ERAp>=120, WLperc>=.600, and SO>=150), sorted by greatest ERAp" in an attempt to find some of the most dominant seasons by a Yankees' left-handed starting pitcher.  Here are the results:

  Cnt Player            ERA+  GS  W-L%  SO Year Age Tm
+----+-----------------+----+---+-----+---+----+---+---+
    1 Ron Guidry         208  35  .893 248 1978  27 NYY
    2 Lefty Gomez        191  34  .656 194 1937  28 NYY
    3 Lefty Gomez        175  33  .839 158 1934  25 NYY
    4 Whitey Ford        170  36  .739 172 1964  35 NYY
    5 Andy Pettitte      155  35  .720 166 1997  25 NYY
    6 Ron Guidry         146  30  .692 201 1979  28 NYY
    7 Jimmy Key          139  34  .750 173 1993  32 NYY
    8 Whitey Ford        130  37  .680 160 1962  33 NYY
    9 Andy Pettitte      129  34  .724 162 1996  24 NYY
   10 Whitey Ford        128  37  .774 189 1963  34 NYY
   11 David Wells        127  30  .818 163 1998  35 NYY
   12 Lefty Gomez        122  30  .615 163 1933  24 NYY

Seasons/Careers found: 12.

What's interesting here, at least to me, is that Lefty Gomez (1933-34), Ron Guidry (1978-79), and Andy Pettitte (1996-97) did this in back-to-back seasons and Whitey Ford (1962-64) did it in back-to-back-to-back seasons.

CC Sabathia will be a Yankee, at least he should be, for the next three seasons - at a minimum.  Can he fashion two "great" seasons in a row, during this time, and join this list?  Time will tell...

Posted in Season Finders | 3 Comments »

100+ RBI in 3 straight years for OF

Posted by Andy on December 12, 2008

In this piece about Raul Ibanez signing with the Phillies, Jayson Stark points out that only 5 outfielders have had 100 RBI in each of the last 3 seasons.

                   From  To   Ages Seasons Link to Individual Seasons
+-----------------+----+----+-----+-------+------------------------------+
 Magglio Ordonez   2006 2008 32-34       3 Ind. Seasons
 Carlos Lee        2006 2008 30-32       3 Ind. Seasons
 Raul Ibanez       2006 2008 34-36       3 Ind. Seasons
 Carlos Beltran    2006 2008 29-31       3 Ind. Seasons
 Bobby Abreu       2006 2008 32-34       3 Ind. Seasons

When I saw that, I was surprised that only 5 OFs had done it. I was sure that in the mid 1990s, the total was higher. But I was basically wrong. Most 3-year periods from 1993 onward, there were 3 to 5 guys (occasionally 6) who had done it for the 3 years previously. Before that, only 1 to 3 outfielders had usually done it in any given 3-year period.

Posted in Season Finders | 4 Comments »

More on catchers

Posted by Andy on December 11, 2008

Recently I wrote that the Red Sox should try to keep Jason Varitek because catcher's offensive contributions have been steadily in decline. My metric of 20 HR, 75 RBI seasons was (reasonably) questioned by some, so here is a less arbitrary way of looking at it.

Using the basic splits across the major leagues (such as can be found here) I've graphed OPS+ contributions by positions as far back as the data goes, to 1956.

Here is the raw data:

So remember that an average major leaguer comes in at 100. A quick look at the above graph reveals things like:

  • Overall, there is far less spread among the positions today than there used to be, save for the early 1980s when the spread was also small.
  • First baseman have been the biggest contributors, leading baseball almost every year. The difference was huge back prior to the mid-70s, when 1B's occasionally had OPS+ values as high as 130!!
  • Other above-average contributors have been RF, LF, DH, 3B, and CF, with each of those positions being above 100 nearly every single year.
  • Centerfielders have been on a continuous decline over the last 50 years. In the late 1950s, they were as highly ranked as 1B and the corner outfielders. By the 1970s, third basemen had caught CFs. In the last 5 years, CFs have now fallen below 3B.
  • Catchers, shortstops, and second basemen have been below average nearly all years.
  • However, while catchers show a steady decline over this 50-year period, 2Bs and SSs have come closer to the pack, consistently hitting 90 or higher the last bunch of years.
  • Finally, and more to the main point of this post, catchers how now fallen to be the least-contributing group in baseball. They have been dead last or tied for last in 7 out of the last 8 years.

There are numerous other interesting things that can be gleaned from the above graph, such as the bumps up in 1998 for 1B and RF when McGwire and Sosa when on their HR-hitting sprees. I encourage you to take a more detailed look at the plot on your own.

For those who'd prefer a simpler view, I offer this 10-year average of the above data. So, for example, the data for 2008 is an average of the values by position for the years 1999 through 2008.

This graph very clearly shows the gradual and continual decline of catchers. They were close to average in the 1960s but have steadily fallen off. By this 10-year average, they've actually become the worst group in baseball in the last 2 years.

Accepting the fact that catchers are the least productive hitters, this doesn't mean that the Red Sox should accept a terrible offensive player at the position. What it does mean, though, is that they are unlikely to be able to find a catcher that is a truly significant contributor, and assuming that Varitek's value to the pitching staff is real and significant, I feel that they are better off with him than with some other offensively-average catcher.

Posted in Splits | 5 Comments »

Red Sox should keep Jason Varitek

Posted by Andy on December 9, 2008

There has been much discussion about whether the Red Sox should try to retain Jason Varitek. Aside from having Scott Boras as his agent, the basic argument can be boiled down like this:

PRO: Varitek is an amazing catcher with a fantastic memory and is a huge boon to the pitching staff (a fact that I have never heard anybody dispute)

CON: Varitek has been a pretty poor hitter over the last 1.5 seasons (also a fact that I have never heard anybody dispute.)

I would argue that the Red Sox should keep Varitek, assuming they can find a 2-year contract that makes sense. I believe that offensive contributions from catchers are thought to be more significant than they are.

Those of us old enough to remember baseball back in the 80s and earlier recall that catchers were rarely major offensive forces. Players like Johnny Bench and Gary Carter were very much the rarity and not the norm. It's easy to forget now, but when Mike Piazza first came along, he was so often heralded as the greatest offensive catcher since Bench or perhaps ever. The graph below shows that it was during The Steroids Era that catchers saw unprecedented offensive success, at least when measuring by number of 20 HR, 75 RBI seasons.

The red points are the data and the black line is a 5-year average.

It wasn't until the mid-1990s that as many as 5 catchers ever had such output in the same year. At this time, the 5-year average hit 4 catchers per year, an average that was never reached previously in MLB history.

It's also true that we've seen a significant dropoff from 1999 to this past season. The high of 5 catchers in 1999 has come down to just 2 catchers the last 2 seasons.

However, the above graph is tough to understand in a vacuum. For instance, the number of teams and number of games in a season has changed over the years. In theory, more catchers should be getting 20 HR, 75 RBI seasons these days than in past decades simply because there are more teams now. Plus, trends in the game have changed, with run scoring going through peaks and valleys, making it more or less likely at different times for any given player to achieve certain statistical totals. We know that lots of players accumulated large HR and RBI totals in The Steroids Era.

So, let's normalize performance by catchers. First, I determined the total number of 20 HR, 75 RBI seasons each year by players at any position, and then found the fraction each year that were achieved by catchers. That tells us a lot more while eliminating factors such as number of teams or games.

Wow, I bet you weren't expecting this, were you? What this graph is telling us that pretty continuously over the last 80 or so years, catchers have contributed fewer and fewer 20 HR, 75 RBI seasons to baseball. Some of this could be because fewer catchers are playing enough games to achieve these totals, but my guess is that it's more than that. Other than the extreme drop-off in the three year period 1988-1990, catchers today are contributing the smallest percentage of 20 HR, 75 RBI seasons since the mid-1940s.

Why do I think this means that the Red Sox should resign Varitek? Basically, I'm saying that as a .220 hitter, his offensive contributions are not so much less than could reasonably be expected. An average catcher over 450 AB might produce 15 to 20 more hits a year, and while those additional hits would produce a few more runs, that difference may well be balanced by Varitek's added value to the pitching staff as compared to an average catcher.

Mind you, if Boston had the opportunity to go out and get an above-average catcher such as Brian McCann, that guy would likely be more valuable than Varitek. But with good catching at such a premium, as it usually has been for most periods in baseball history, Boston is unlikely to be able to acquire such a player and is far better off sticking with Varitek.

Posted in Season Finders, Uncategorized | 2 Comments »

Fewest Pitches by a Winning Starter

Posted by Raphy on December 8, 2008

In honor of Greg Maddux retiring I thought it might be interesting to take a look at this list. Over the years Maddux has been known for for being dominant, economical with his pitches, and sometimes quick to leave a game.

Here are the games over the last ten years in the which the fewest pitches were thrown by a starter who recorded a win.

  Cnt Player            Date          Tm   Opp GmReslt App,Dec    IP   H  R ER BB SO HR **Pit** Str GmSc IR IS BF AB 2B 3B IBB HBP SH SF GDP SB CS Pk BK WP   ERA
+----+-----------------+-------------+---+----+-------+---------+----+--+--+--+--+--+--+-------+---+----+--+--+--+--+--+--+---+---+--+--+---+--+--+--+--+--+------+
    1 Greg Maddux       2003-09-21    ATL  FLA W  8-0  GS-5  ,W   5    1  0  0  0  0  0    43    29   65       16 16  0  0   0   0  0  0   0  0  0  0  0  0   0.00 

    2 John Smoltz       2005-05-06    ATL  HOU W  9-4  GS-5  ,W   5    2  1  1  0  2  0    46    36   61       17 17  1  0   0   0  0  0   0  0  0  0  0  0   1.80 

    3 Greg Maddux       2008-09-27    LAD @SFG W  2-1  GS-6  ,W   6    2  1  1  0  2  1    47    38   66       19 19  0  0   0   0  0  0   0  0  1  0  0  0   1.50 

    4 Greg Maddux       2002-05-31    ATL @CIN W  7-0  GS-5  ,W   5    2  0  0  1  2  0    51    36   64       17 16  0  0   0   0  0  0   0  1  1  0  0  0   0.00 

    5 Greg Maddux       2002-09-27(1) ATL @NYM W  3-1  GS-5  ,W   5    5  1  1  0  4  0    53    40   57       18 17  0  0   0   0  1  0   2  1  0  0  0  0   1.80 

    6 Masato Yoshii     2002-04-16    MON  CHC W  8-4  GS-5  ,W   5    3  1  1  1  1  0    54    34   57       18 17  1  0   0   0  0  0   1  1  0  0  0  0   1.80 

    7 Edgar Gonzalez    2007-09-16    ARI @LAD W  6-1  GS-5  ,W   5    6  1  1  1  1  1    55    37   51       18 17  0  0   0   0  0  0   2  0  1  0  0  0   1.80 
    8 Wandy Rodriguez   2005-08-30    HOU  CIN W  5-2  GS-5  ,W   5    4  1  1  1  4  0    55    38   58       19 18  1  0   0   0  0  0   0  0  0  0  0  0   1.80 

    9 Chris Sampson     2008-07-05    HOU @ATL W  6-1  GS-5  ,W   5    2  1  1  0  2  1    56    36   61       17 17  0  0   0   0  0  0   0  0  0  0  0  0   1.80 
   10 Rocky Biddle      2004-07-10    MON  PIT W  4-0  GS-5  ,W   5    2  0  0  1  3  0    56    35   65       17 14  0  0   0   2  0  0   2  0  1  0  0  0   0.00 

4 out of 5 ain't bad.

Posted in Game Finders | 6 Comments »

Post-2003 Yanks Starting Pitching Scorecard

Posted by Steve Lombardi on December 7, 2008

Playing around with Baseball-Reference.com's Play Index Pitching Season Finder, I asked it to show me, since 2004, how many Yankees pitchers have posted a season where they appeared in at least 28 games, with 90% of them being starts, and had an ERA+ of 110 (or greater) on the season. Here's that list:

                   From  To   Ages Seasons
+-----------------+----+----+-----+-------+
 Chien-Ming Wang   2006 2007 26-27       2
 Mike Mussina      2006 2008 37-39       2
 Andy Pettitte     2007 2007 35-35       1
 Randy Johnson     2005 2005 41-41       1

Seasons/Careers found: 4.

That's it. In the last five years the Yankees have only had four starting pitchers to have "very good" seasons - and, in total, these four have authored six such seasons.

Think about that for a moment. Assume that, in a perfect world, you had 5 starting pitchers in your rotation and each of them never missed a turn. That means you would have 5 "starting seasons" per year. Now, multiply that by five seasons (from 2004 through 2008). That's twenty-five.

So, in this department, the Yankees have gone 6 for 25 - or a percentage of 24%. Sounds bad, right?

Well, check out the Boston Red Sox, using the same filters, since 2004:

                   From  To   Ages Seasons
+-----------------+----+----+-----+-------+
 Curt Schilling    2004 2006 37-39       2
 Tim Wakefield     2008 2008 41-41       1
 Daisuke Matsuzaka 2008 2008 27-27       1
 Jon Lester        2008 2008 24-24       1
 Josh Beckett      2007 2007 27-27       1
 Pedro Martinez    2004 2004 32-32       1
 Bronson Arroyo    2004 2004 27-27       1

Seasons/Careers found: 7.

Boston, over this time, has posted 8 such seasons (from 7 pitchers). So, the Red Sox are at 32%.This makes me think that we should lower that ERA+ bar. What happens if we move it to an ERA+ of 100 (or greater)? Here are those results:

Yankees:

                   From  To   Ages Seasons
+-----------------+----+----+-----+-------+
 Chien-Ming Wang   2006 2007 26-27       2
 Mike Mussina      2006 2008 37-39       2
 Andy Pettitte     2007 2007 35-35       1
 Jaret Wright      2006 2006 30-30       1
 Randy Johnson     2005 2005 41-41       1

Seasons/Careers found: 5.

Red Sox:

                   From  To   Ages Seasons
+-----------------+----+----+-----+-------+
 Tim Wakefield     2004 2008 37-41       4
 Daisuke Matsuzaka 2007 2008 26-27       2
 Curt Schilling    2004 2006 37-39       2
 Bronson Arroyo    2004 2005 27-28       2
 Jon Lester        2008 2008 24-24       1
 Josh Beckett      2007 2007 27-27       1
 David Wells       2005 2005 42-42       1
 Pedro Martinez    2004 2004 32-32       1

Seasons/Careers found: 8.

Well, there it is, huh? Since 2004, the Yankees have had just 7 "solid" seasons from a starting pitcher (coming from 5 starters) whereas the Red Sox have had 14 "solid" seasons from a starting pitcher (coming from 8 starters).

This puts the Yankees at 28% for a success rate whereas the Red Sox have a success rate of 56% over the same period of time. Do the math on that one - it's double.

So, if you want to know why the Red Sox have two World Series rings since 2004 and the Yankees have zero, part of the reason is the fact that Boston (and their front office) has lapped the Yankees (and their front office) in terms of identifying and retaining quality starting pitching.

And, unless the Yankees organization can close this front office efficiency gap with respect to filling out a starting rotation, don't expect New York to catch up to Boston, any time soon, in that ring tally board.

Posted in Season Finders | 1 Comment »

Joe (Big Game) Carter?

Posted by Steve Lombardi on December 3, 2008

Just playing around with Baseball-Reference.com's Play Index Batting Game Finder, I asked it to show me, since 1956 (of course) who had the most games with:  TOB>=3, XBH>=3, R>=3, and RBI>=3

I was very surprised to see Joe Carter on the top of this list.  In any event, he's the leader board for the "Four Threes (or greater)" -

                   Games Link to Individual Games
+-----------------+-----+-------------------------+
 Joe Carter           10 Ind. Games
 Frank Robinson        9 Ind. Games
 Manny Ramirez         9 Ind. Games
 Carlos Delgado        9 Ind. Games
 Willie Stargell       8 Ind. Games
 Willie Mays           8 Ind. Games
 Dave Kingman          8 Ind. Games
 Steve Finley          8 Ind. Games
 Larry Walker          7 Ind. Games
 Sammy Sosa            7 Ind. Games
 Alex Rodriguez        7 Ind. Games
 Barry Bonds           7 Ind. Games
 Billy Williams        6 Ind. Games
 Mark Teixeira         6 Ind. Games
 Darryl Strawberry     6 Ind. Games
 Jim Rice              6 Ind. Games
 Dale Murphy           6 Ind. Games
 Mark McGwire          6 Ind. Games
 Luis Gonzalez         6 Ind. Games
 Ellis Burks           6 Ind. Games
 Albert Belle          6 Ind. Games
 Jeff Bagwell          6 Ind. Games
 Garret Anderson       6 Ind. Games
 Moises Alou           6 Ind. Games
 Hank Aaron            6 Ind. Games

Posted in Game Finders | 4 Comments »